

When temperatures climb, grass suffers, and so does anyone relying on that turf to stay green, safe, and functional. To put TourTurf® GTP Green Turf Paint to the test under exactly these conditions, a controlled trial using Grow Tent lights was conducted, subjecting matched turf strips to high-intensity grow lights designed to simulate peak summer heat stress.
Depending on the mixing ratio, GTP delivers a natural colour with a slightly bluer tone than traditional green pigments. Applications of 1–3 l/ha are recommended during periods of high temperatures, while 1–2 l/ha effectively mask symptoms of disease, drought and other stress-related discolouration. For Agrostis stolonifera, higher application rates are recommended to achieve the most natural and uniform colour coverage.
| Treatment | Application Rates |
| Water | N / A |
| High | 1.5 L / ha |
| High+ | 5 L / ha |
Table 1 Application rates of treatments for this trial.
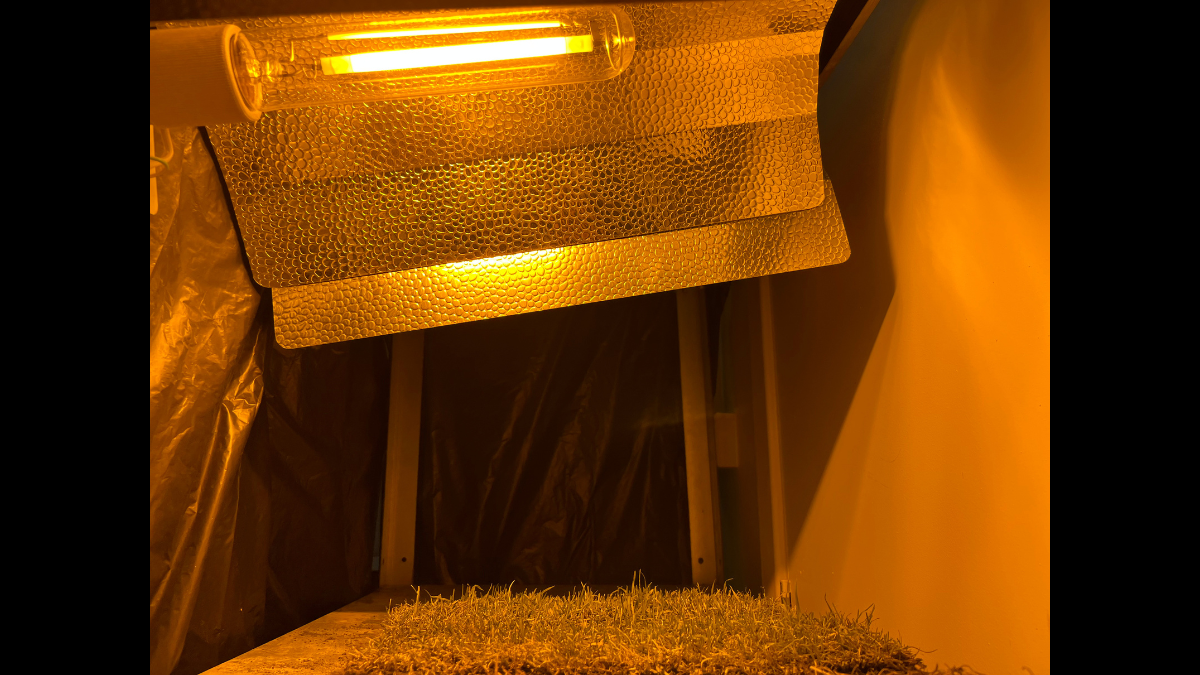
Two sets of strips were treated with GTP and a third, untreated control set received only water (table 1). Using FLIR thermal imaging, surface temperature differences were tracked between the three groups in real time, capturing not just numbers, but a visual picture of heat building up (or being held at bay) across the turf.
The early results speak for themselves. The GTP-treated strips ran measurably cooler than their water-only counterparts, and the visual contrast was just as striking: the treated turf stayed green and healthy, with visible new growth, while the untreated strips showed clear signs of heat stress and decline.
What follows is a closer look at the trial, what the thermal imaging revealed, and what it means for turf performance in real-world heat.
Measuring the Colour: What L*a*b* Tells Us
To back up the visual difference between treatments, a colorimeter was used to measure each strip's colour on the L*a*b* scale, the industry-standard system for describing colour numerically. L* measures lightness, from 0 (black) to 100 (white). a* measures the green–red axis, with negative values indicating green and positive values indicating red. b* measures the blue–yellow axis, with higher positive values indicating more yellow.
The three treatments told a clear story (figure 1):
-
Water/Untreated: a* sits in positive territory (around +2.5), meaning the strip leans away from true green, with a lower b* value (~16.5), consistent with the duller, stressed appearance seen in the untreated group.
-
High rate: a* moves into negative territory (~-2), and b* jumps to ~26, a stronger, more vivid green signature. High+ rate: a* is the most negative of the three (~-5), indicating the deepest green reading, paired with the highest b* value (~35) for the richest, most saturated colour overall, though a lower L* value (~27.5) shows this strip was also the darkest.
-
High+ rate: a* is the most negative of the three (~-5), indicating the deepest green reading, paired with the highest b* value (~35) for the richest, most saturated colour overall, though a lower L* value (~27.5) shows this strip was also the darkest.
It is worth noting that on the L*a*b* scale, the b* value on its own simply measures how far a colour sits on the blue–yellow axis, with higher values indicating more yellow rather than "more colour" in a general sense. Healthy grass naturally reads as yellow-green rather than true green, so a positive b* value isn't a concern in isolation, what matters is how it moves alongside a*. In this trial, as GTP application rate increased, a* shifted from +2.5 in the untreated strip to -5 in the highest-rate treatment, indicating a much stronger true-green colour signature. The accompanying rise in b* is consistent with this, a natural, vivid yellow-green typical of healthy, actively growing turf, rather than a shift toward yellowing or chlorosis, which would typically show a rising b* without a corresponding move toward green in a*.
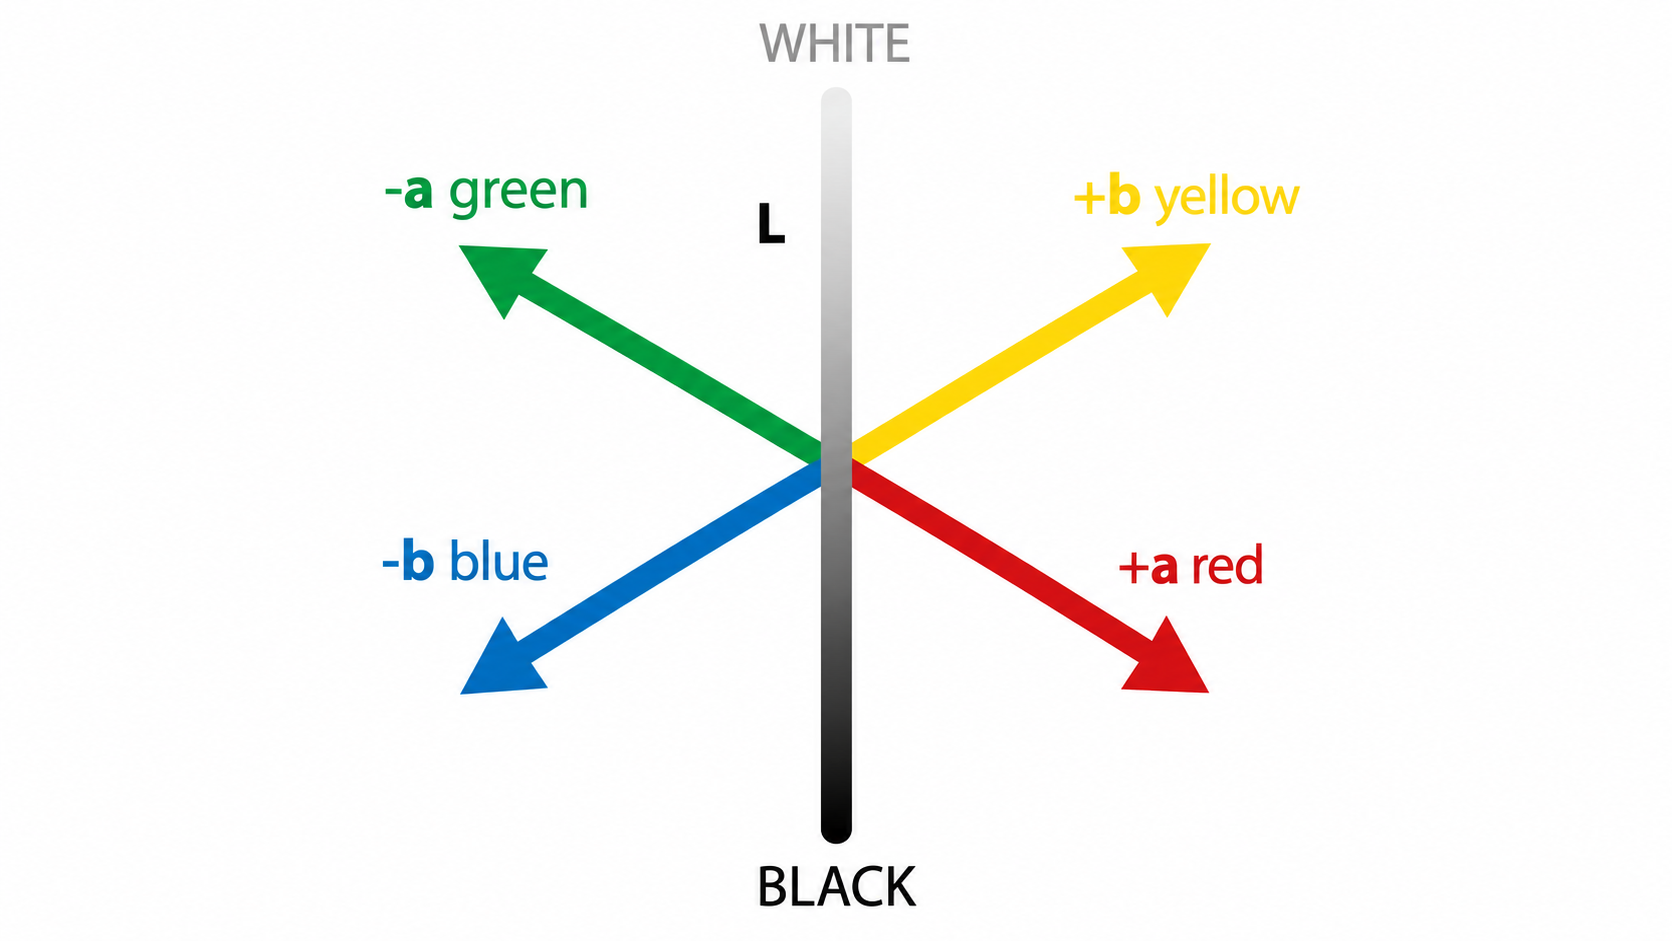
The L*a*b* scale—also called CIELAB
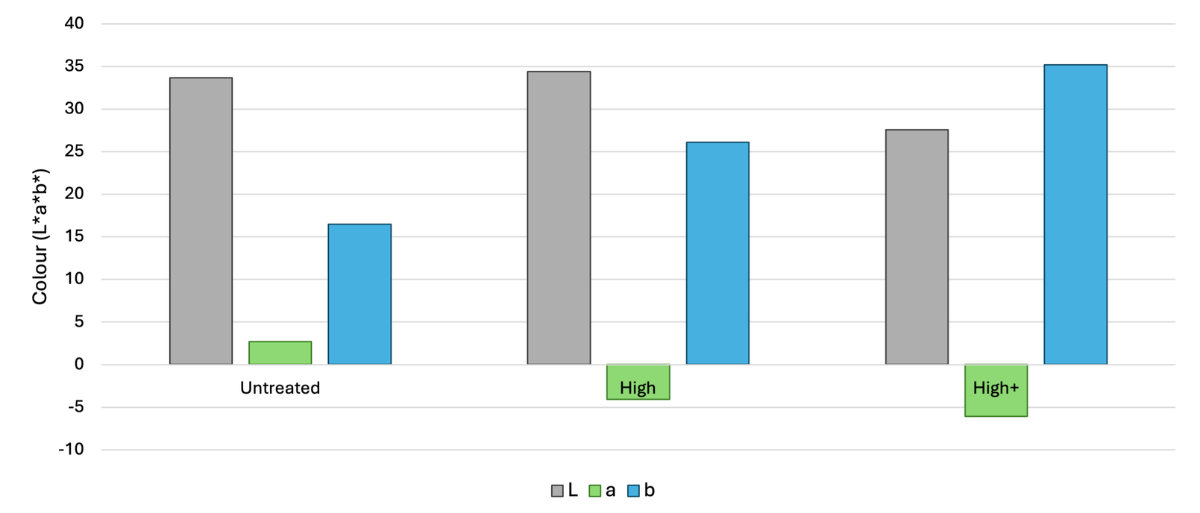
Figure 1 L*a*b* colour as measured using a colorimeter showing the health of the turf strips.
In short: as GTP application rate increased, the colour reading moved further into the green space and became more vivid, mirroring what we could see with the naked eye, the higher the rate, the healthier and greener the strip appeared.
Further adding to this visual observation of a more vivid green colour after exposure to light stress, the strips treated with GTP also showed growth, with the turf blades being much longer than the Untreated group (figure 2).
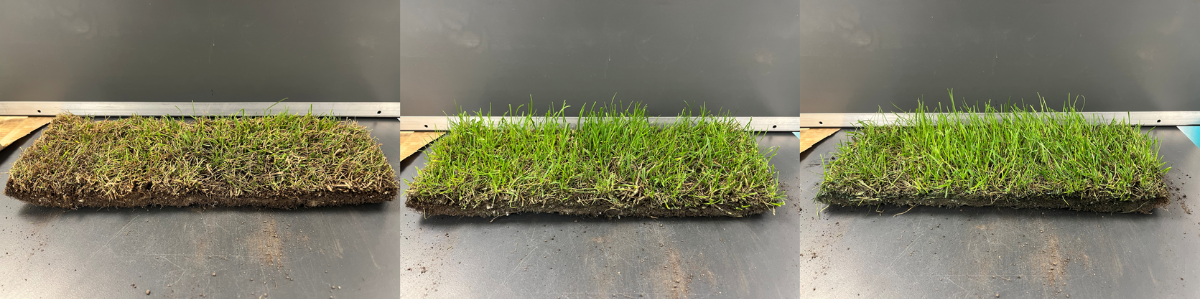
Figure 2 Turf strips after being exposed to light stress showing grass blade growth, treatments are: Untreated (left), GTP High (middle), GTP High+ (right).
Cooling Rate After Light Exposure
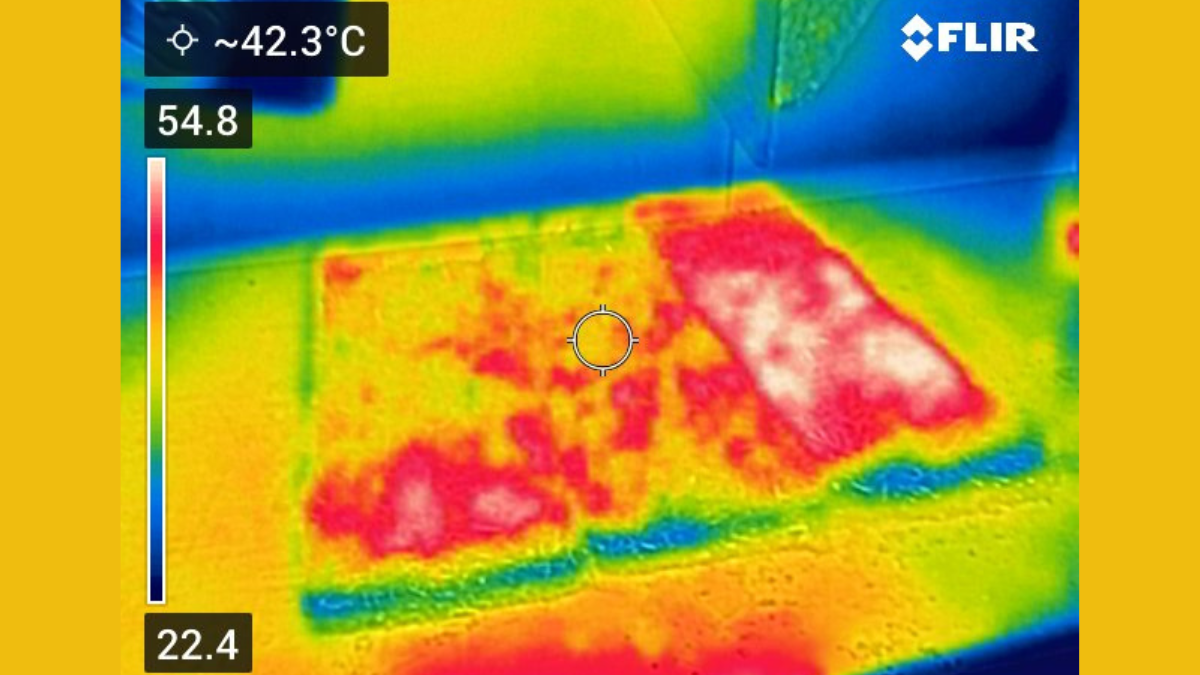
Figure 3 FLIR image taken while strips were actively under the grow lights, Untreated (right), High (middle), High+ (left).
Alongside the FLIR imaging taken while strips were under the 400W grow lights (figure 3), how quickly each strip cooled once removed was tracked (figure 4 and figure 5), photographing surface temperature every 5 minutes for 30 minutes.
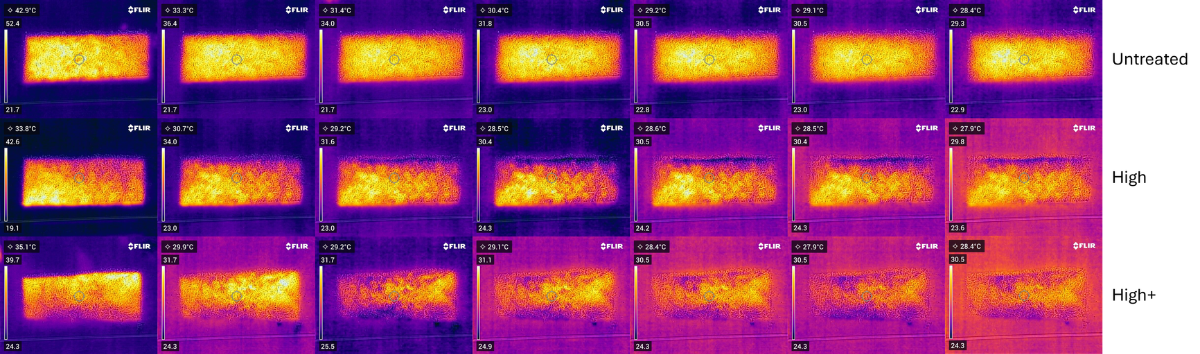
Figure 4 FLIR images taken of the strips as they cooled. From left to right = 0 mins, 5 mins, 10 mins, 15 mins, 20 mins, 25 mins, 30 mins.
The untreated strip told the most dramatic story here. Having reached the highest temperature under the lights (~43°C), it cooled rapidly in the first 5 minutes but then continued a slow, steady decline for the full 30 minutes, only converging with the treated strips near the end. The High and High+ treated strips, by contrast, started from a much lower baseline (~34–35°C) and settled quickly, reaching a stable temperature within the first 10–15 minutes.
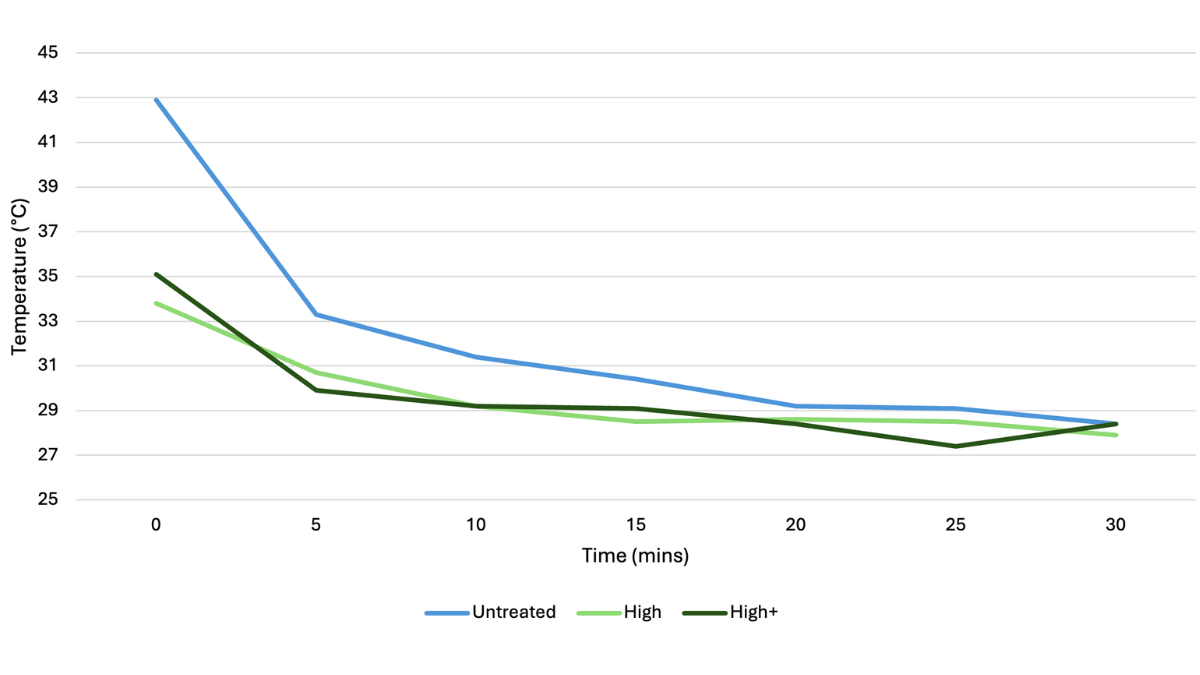
Figure 5 Temperature of turf strips when left to cool for 30 minutes.
This reinforces the core finding: GTP doesn't just reduce peak temperature under light stress, the treated turf runs cooler throughout, rather than needing to "catch down" once the heat source is removed.
Why Colour Wavelength Matters
The link between GTP's blue pigment and its cooling effect comes down to how different wavelengths of light interact with the plant. Visible light spans roughly 400–700 nanometres, and within that range, plants rely on Photosynthetically Active Radiation (PAR) to drive photosynthesis. Wavelengths shorter than 400nm (UV light) fall outside this useful range and instead damage plant cells, in much the same way UV rays damage human skin.
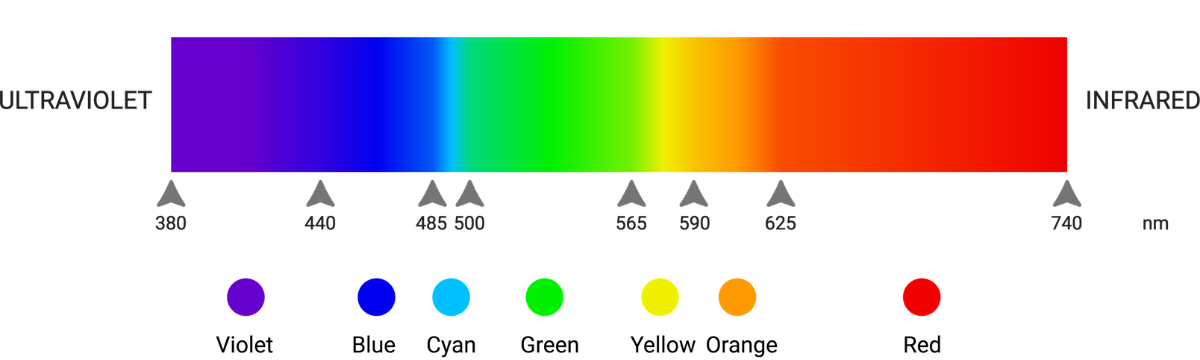
Visible Light Spectrum
Where plants naturally defend themselves using carotenoid pigments, GTP's blue pigment performs a similar photo-protective role, selectively reflecting harmful UV wavelengths while still allowing beneficial PAR wavelengths through to fuel photosynthesis. This is a deliberate balance: earlier trials found that pushing the blue pigment concentration too high (5%) blocked too much of the light the plant actually needs, ultimately doing more harm than good. GTP's formulation is designed to sit in the sweet spot, enough blue pigment to shield against UV and heat stress, without starving the plant of the light it needs to grow.
This trial's results are consistent with that mechanism. The higher-rate GTP treatments not only ran cooler under the grow lights and cooled faster once removed, but also showed a stronger green colour signature on the L*a*b* scale, indicating a healthier, more photosynthetically active canopy rather than simply a cosmetic colour change. The untreated strip, by contrast, ran the hottest under the lights and took the longest to recover once removed, a sign of a plant under active heat stress, with less capacity to regulate its own temperature.
Taken together, the FLIR imaging, colorimeter data and cooling-rate results all point to the same conclusion: GTP's blue pigment isn't just cosmetic. By reflecting damaging UV wavelengths while preserving the light plants need for photosynthesis, it helps turf stay cooler, healthier and actively growing under high light intensity, reinforcing what was seen in previous TourTurf® GTP trials on heat stress and UV protection.